


Expected Progeny Differences (EPDs) in Beef Cattle1
By Hansen, G.R., Assistant Professor of Animal Science, University of Florida, NFREC Marianna, and Riley, D.G, Research Geneticist, Subtropical Agriculture Research Station Brookesville. Table of Contents
Expect Progeny Difference
Genetic Trends
Average Breed EPDs
Accuracy
Do EPDs Work?
Using EPDs
Contemporary Grouping
Percentile Ranking
Summary
Production Traits
Expected Progeny Differences (EPDs) were developed to provide cattle producers with an effective tool to evaluate prospective breeding stock. As the name implies, EPDs predict the performance of future offspring from an individual animal. More specifically, EPDs predict the genetic transmitting ability of an individual as a parent. Using EPDs can increase the rate of genetic progress in a selection program. National Cattle Evaluation (NCE) models include:
Expect Progeny Difference
An EPD is a prediction, based on current information, of one-half the breeding value of the animal that is predicted to be passed on to its potential progeny. EPDs are used to evaluate the genetic merit of individuals when used in a breeding program. As an example, the difference in EPDs between two bulls is an estimation of difference in performance of their progeny provided they were bred to cows of equal merit and their progeny were subject to the same environmental conditions. Although the statistical models used to calculate EPDs are cumbersome and require large computational systems, the end result is a single value that allows for the direct comparison of animals within a breed. Some basic principles must be followed in order for EPDs to be used wisely in a genetic selection program.First, EPDs are specific to a breed and analysis date. Do not compare individuals from one breed to another breed unless using a cross-breed EPD adjustment factors. Second, do not compare EPDs that were generated in prior sire summaries to EPDs generated in a current summary because EPD values will change between analyses. Third, keep in mind EPDs are predictions based on averages. Reiterating from above, if two bulls are bred to cows of equal genetic merit and are subject to the same environmental conditions, then their progeny on average would be expected to differ for the selected trait according to the difference in the EPD values. Using weaning weight as the example, progeny from bull A with a weaning weight EPD of +40 lbs and bull B with a +30 lbs, then bull As progeny on average would be expected to be 10 lbs heavier at weaning than bull Bs progeny. Using weaning weight as an example, if bull A with a weaning weight EPD of + 40 lbs and bull B with a + 30 lbs where mated to cows of equal genetic merit, we would expect bull A's progeny on average to be 10 lbs heavier at weaning than bull B's progeny. Consider the EPDs for the bulls in Table 1.
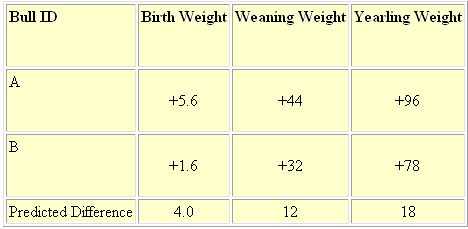 Table 1. Growth Trait EPDs for Two Bulls.
|
When the two bulls are compared, we would expect calves from bull A to weigh 4 lbs more at birth, and to be 12 lbs heavier at weaning and 18 lbs heavier as yearlings. This does not mean that bull A would increase birth weight 5.6 lbs, add 44 lbs at weaning and or add 96 pounds at yearling within a herd. These changes would depend on the average EPD (production) within the producer's herd. For example, if the average EPD in the producers herd for birth weight was 4.0 lbs, then bull A would be expected to increase birth weight by +1.6 lbs within this particular herd. However, it is difficult to calculate an accurate average herd EPD because animals with various accuracy values would be included in the calculation.
Genetic Trends
Over time, EPDs within breed associations' National Cattle Evaluation's change as producers emphasize different traits in order to build upon strengths or weaknesses that are inherent in a breed. This type of selection results in genetic trends being established from year to year. For example, breeds that have large birth weights would have a goal to reduce birth weight within their herds, making the genetic trend for birth weight negative. Breeds with low growth rates would select for increased growth thereby causing the genetic trend for growth traits to be positive. Genetic trend is important because it indicates which direction the breed is moving in for various traits.Genetic trend can be best illustrated in an example from the Hereford Breed Association (Table 2). Notice that average birth weight EPD increased from 1975 to 2000 by 4.2 lbs but birth weight remained the same from 2000 to 2005, indicating that birth weight has leveled off and is being maintained at current EPD levels in the Hereford breed. On the other hand, EPDs for weaning weight, yearling weight, milk and scrotal circumference have increased 31.6 lbs, 56.7 lbs, 12.8 lbs and 1.5cm, respectively. This demonstrates that breeders are selecting animals that will increase EPDs in these traits. Genetic trends are available for all of the major breed associations and should be used to determine if a specific breed is moving in a manner consistent with producers' goals.
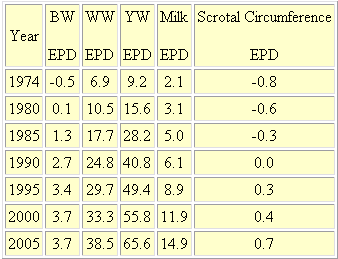 Table 2. Hereford Genetic Trend by Birth Year.
|
Average Breed EPDs
All EPDs are reported relative to a base population. Each breed's base year is arbitrary. Most bases are obtained by forcing the EPDs for all animals in a particular year to sum to zero. Therefore, EPDs reported on animals born in the current year are relative to average genetic merit of animals born in the base year. Breed associations publish the current average breed EPDs with each analysis to aid producers in determining the merit of young animals in the breed. An animal with a 0.0 EPD would not necessarily be at the current breed average. Table 3 lists current average breed EPDs for several breeds. Notice that an Angus born in 2006 with a birth EPD of +2.3 would be average for birth weight EPD, while a bull with a 0.0 EPD would be below the current average. Livestock producers should become familiar with current breed EPD averages for the breeds that they use in their breeding programs.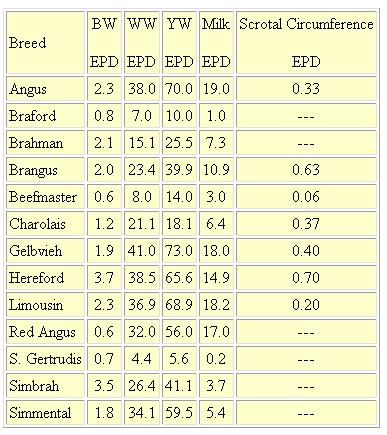 Table 3. Current Breed Average EPDs of Active Sires (2005-2006).
|
Accuracy
While EPDs are the best estimates of an animal's genetic transmitting ability, there is still margin for error or a possible change associated with the estimates. Accuracy values are published with an EPD to help indicate the amount of risk an individual will take when using an animal in a breeding program. Accuracies reported in National Cattle Evaluations are correlations and range from zero to one with larger values indicating less risk of an EPD changing as additional data is included in the analysis. Accuracy is a reflection of the number and distribution of progeny per sire along with how much pedigree information is available. Accuracy values give us an indication of how close our estimates are to an animals true genetic value. Table 4 shows how much an EPD for a Charolais sire could possibly change as more information (individual performance and future progeny) is included in the National Cattle Evaluations.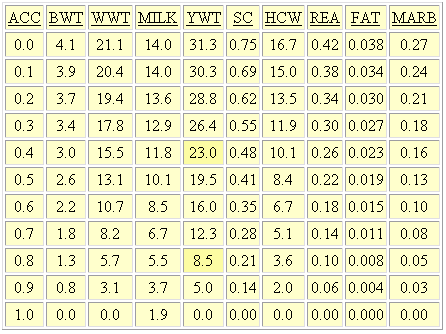 Table 4. Possible Change in EPD Values at Different Accuracy Levels (AICA Spring 2005).
|
Accuracy values(ACCs) are extremely useful to breeders in determining the reliability of an EPD. Notice that as ACC level increases, the possible change value decreases. Still, an EPD can change from year to year even though it may have a high level of accuracy. The point to remember is that the expected change of an EPD with a high accuracy value is correspondingly less than that of an EPD with a lower accuracy value.
The possible change of identical EPDs, given different levels of accuracy can be seen in the following example of two Charolais bulls. Two sires have yearling weight EPD of +30, but differ as to accuracy value. Figure 1 illustrates the possible range within which the true genetic value is. Sire A has an accuracy of .40 with a possible change value of 23 lbs, and sire B has an accuracy of .80 with a possible change value of 8.5 lbs.
Accuracy values help determine the amount of risk associated with genetic repeatability, but they are not foolproof. The table above shows the possible change values of an EPD with a given accuracy value (ACC). Approximately 70 percent of the time the EPD should not deviate outside of these parameters. In other words, the true value should fall within the EPD ± one possible change value.
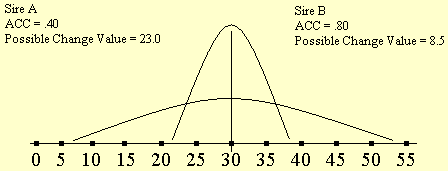 Figure 1.
Possible Change Values for two Charolais bulls. American International Charolais Association |
The accuracy of a given EPD can help determine the amount of risk a breeder is willing to take when making breeding decisions. Let us compare the sires in the example again. Which sire is more desirable for your breeding program? The sire with the high accuracy is more predictable, but the amount of genetic change that can be made is correspondingly limited as well. Sire A has the same yearling EPD, but his true genetic value may be beyond that of Sire B. Therefore Sire A could possibly increase the amount of genetic progress made, but he is also more of a risk because his true genetic value falls within a wider range.
Cattle producers should use EPDs to decide which individuals to use and should use accuracy values to determine how extensively an individual should be used in a breeding program. Bulls with low accuracies should be used on a limited basis while bulls with high accuracies can be used as deemed necessary. Table 5 summarizes accuracy values in relation to associated risk. Bulls with accuracy values of less than .40 are considered high risk because their EPDs have a high probability of changing as more information is included in the analysis. On the other hand, bulls with accuracy values greater than .80 have a low probability of changing because large quantities of information were included in the calculation of the EPDs.
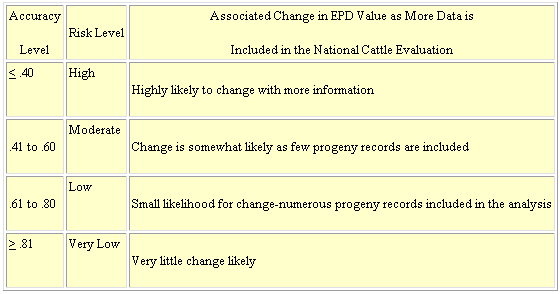
Table 5. Levels of Accuracy and Associated Risk.
|
Do EPDs Work?
Numerous studies have verified that selection using EPDs produces beneficial effects, particularly with weight traits. Researchers in Georgia selected bulls within the top one percentile for yearling weight EPD over a six-year period. Heifers from these sires were returned to herd and their performance was compared to a control group. At the end of the study, 70 % of the base cows had been replaced by the selected heifers. Progeny for the selected heifers was 95 lbs heavier at yearling compared to control animal progeny. They also were 68 lbs heavier at weaning, yearling hip height increased 2.4 inches and birth weight also increased 6.8 pounds. Results of this study point out that it is imperative to know the genetic correlations that exist between traits as a correlated selection response in a related trait can lead to problems. Researchers in Virginia found similar results when comparing two sire groups with average differences in EPD of 2.2 lbs for birth, 9.9 for weaning and 13.9 for yearling. Differences in progeny performance were 4.7 at birth, 16 lbs at weaning, and 26 lbs at yearling.
In a large purebred operation in Texas, bulls were ranked according to EPD value and actual performance for several traits. Only bulls with high EPD accuracy values (80%) were included in the data set. Notice that in almost all cases the bulls ranked the same when comparing actual performance averages to EPD values (Table 6). Using the same data, predicted differences using EPDs were compared to actual performance differences (Table 7). In all comparisons actual performance was close to the predicted performance difference.
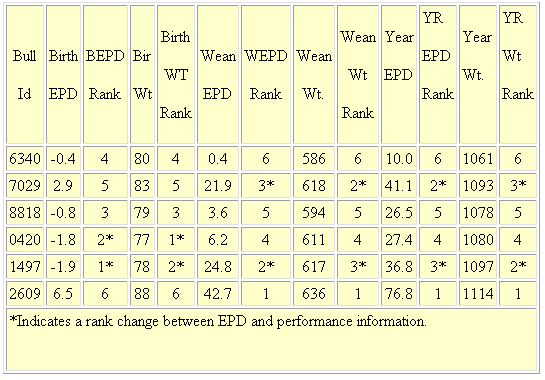
Table 6. Rank Comparison of EPD and Actual Performance.
|
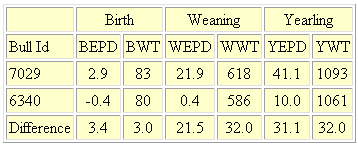
Table 7. Predicted Difference VS. Actual Performance Difference of Two High Accuracy EPD Bulls (>90%) Mated to Cows of Similar Genetic Merit.
|
Several other studies have verified that selection using EPD is the most accurate and quickest way to make genetic change in a beef cattle operation. However, common sense must be used when using EPDs in a beef cattle operation to achieve optimum results.
Using EPDs
Using EPDs in a beef cattle operation can best be illustrated with an example. Suppose six cattle producers are identifying sires to use in their breeding programs. The production objectives for each producer are listed in Table 8. Bulls available to meet the production objectives are quantified in Table 9.
| Selection/ Goals | CED | BW | WW | YM | MM | SC | Fat | REA | IMF |
| 1. Maximize growth with no replacements kept (terminal cross). | none | none | maximise | maximise | none | none | none | none | none |
| 2. Improve growth maintain milk | none | none | maximise | maximise | 15-20 | none | none | none | none |
| 3. Inseminate yearling heifers/minimize dystocia while maintaining growth. | >3.0 | <0.8 | 30-38 | 60-65 | 15-20 | none | none | none | none |
| 4. Improve weaning weight while holding cow mature size at present levels. Post-weaning growth is adequate. Calves sold at weaning. Cows maintain adequate condition with little supplementation. | none | none | 38-42 | 60-70 | 25+ | none | none | none | none |
| 5. Improve carcass quality along with increased growth potential of offspring. | none | none | 40+ | 60+ | none | none | none | none | 0.15+ |
| 6. Save replacement heifers and decrease age of puberty within the herd. Current levels of production for calving ease, weaning and post-weaning gain are acceptable | >0.3 | <3.7 | 38+ | 65+ | 25+ | >0.7 | none | none | none |
Table 8. Matching EPDs to Production Goals
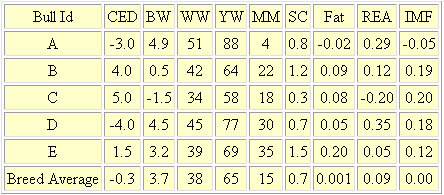
Table 9. EPDs for Prospective Sires.
|
Almost all breed associations have computer sire sorts that allow producers to set independent culling levels (ICLs) for the various traits of interest. Once the ICLs are determined, the producer can search the breed's database for bulls matching the criteria. Sires matching the ICLs are identified and the producer can then select which sires he/she wishes to use. Using ICLs for five traits generated the information in Table 10. Searching for sires using an ICL allows producers to quickly identify bulls that will meet their production goals. Producers should evaluate the bulls that the search returns to insure that calves from these sires will be functional in their herds.
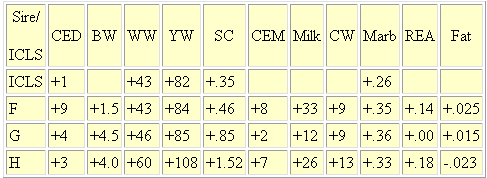
Table 10. Independent Culling Levels for Five traits and EPDs for Three Sires That Match Those Levels
|
Contemporary Grouping
A contemporary group is a set of animals that have been similarly managed, are of the same age and gender, and were exposed to the same environmental conditions, allowing each animal an equal opportunity to perform. This is the best way to account for environmental effects leaving the remaining differences among animals to be genetic. Proper contemporary grouping is crucial for genetic evaluation. Improper grouping of contemporaries is the number one error in NCEs. Any animal that has been removed (temporally or permanently) or treated differently from the rest of the group needs to be eliminated from the contemporary group to insure bias is not introduced. The following guidelines should be used to insure correct contemporary grouping.Contemporary Grouping:
Percentile Ranking
Breed associations publish percentile ranks for EPD values within a given breed. This allows producers to determine acceptable minimum and maximum levels for each trait in his selection program. Once production goals and objectives are established, then appropriate sires can be selected using EPDs from the percentile rank to match each targeted trait. For Example, a bull with a -2.4 birth weight EPD would rank in the top 1% of all the active sires. Table 11 lists percentile breakdown for active sires in the Angus breed.
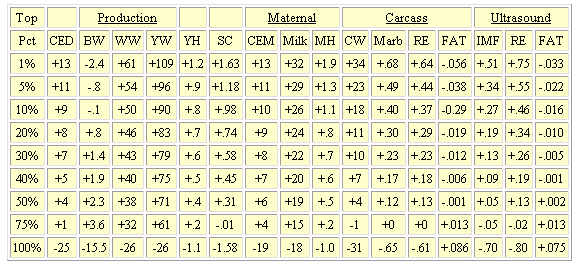
Table 11. Percentile Breakdown Current Sires (Angus 2006)
|
Summary
When selecting breeds and animals within breeds, consideration needs to be given to where animals will be raised and marketed. Market participation is becoming as much a part of the equation in today's beef industry as the environment. Knowing how to optimize resources for your particular herd with regards to environmental constraints, while targeting animals that will be able to compete in the marketplace will be crucial to surviving in the beef cattle industry. Target your market and then work backwards to identify the right animals. To summarize how to use EPDs in your breeding program, consider the following points:
- Know where your cow herd is in relation to your targets, while understanding that your cow herd still has to produce in your environment. Keeping accurate records will help to identify what are the strengths and weaknesses of your cow herd.
- Identify the point in the production chain where offspring will be marketed. Different market end points will determine breeding objectives. Producers selling calves at weaning will use different sires than those selling at yearling or slaughter end points.
- Identify the breeds and animals within those breeds (primarily bulls) that will move the cow herd in the right direction to optimize production within the environment. Producers must be realistic and practical to insure selection of the correct type of animals.
- Insure that EPDs are used in the way they were intended to be used. Compare EPDs for the same sire summary or analysis. Realize that EPDs are estimates and will change as new information becomes available. Avoid animals with extremely high or low EPDs for the traits that you are selecting for. Remember to use common sense when using EPDs. They are tools which when used properly can aid producers in reaching their production goals.
Production Traits
All breed associations generate birth weight (BW), weaning weight (WW), yearling weight (YW) and milk EPDs. From here almost all of the breeds diverge with respect to what EPDs are generated. Listed below are descriptions of each EPD.
Four traits are routinely reported by breed associations that conduct National Cattle Evaluation analyses:
BW (Birth Weight) - The birth weight of a sire's progeny when compared to the breed average, in pounds.
WW (Weaning Weight)- Weaning weight in pounds adjusted to 205 days excluding maternal effects (evaluated as milk).
YW (Yearling Weight) - Yearling weight in pounds adjusted to 365 days excluding maternal effects.
Milk - A measure of the pre-weaning performance, pounds of calf attributed to the milking ability of a sire's daughters. The use of the term milk is inaccurate because the trait measures all maternal effects of which milk is the major , but not the only, factor.
Traits reported by various breed associations include:
CE (Calving Ease) The ease with which a sire's calves are born. Expressed in a percent of unassisted births. Larger positive numbers indicate greater calving ease. Determined largely by the weight of the calf. (Gelbvieh and Simmental)
CED (Calving Ease Direct) Predicts calving ease of a sire when mated to heifers. Expressed as the difference in percentage of unassisted births, with a higher value indicating increased calving ease in first-calf heifers. (Angus, Charolais, Gelbvieh, Hereford, Limousin and Red Angus)
CEM, MCE (Calving Ease Maternal, Maternal Calving Ease) Predicts calving ease in a sire's first-calf daughters in comparison to other sires included in the evaluation. Expressed as the difference of unassisted birth in different sires' daughters when calving as first-calf heifers. (Angus, Charolais, Gelbvieh, Limousin and Simmental.)
CETM (Calving Ease Total Maternal) Describes differences in percent probability of a sire's daughter calving unassisted. (Red Angus and Hereford.)
CW (Carcass Weight) The adjusted carcass weight of a sire's progeny expressed in pounds. (Angus, Brahman, Brangus, Charolais, Gelbvieh, Hereford, Limousin, Red Angus, Simbrah and Simmental.)
DOC (Docility) Measure of an animal's temperament, nervousness and flightiness when handled. (Limousin.)
Fat (Fat Thickness) Backfat thickness measured over the ribeye at the 12th/13th rib. Used as a predictor of total body fat being the major factor in calculating yield grade. (Angus, Brahman, Brangus, Charolais, Gelbvieh, Red Angus, Simbrah and Simmental.)
GL (Gestation Length) The interval from conception to parturition measured in days. (Gelbvieh.)
HPG (Heifer Pregnancy) Describes the difference in percent probability of female progeny conceiving as two-year-olds. (Red Angus.)
IMF (Intramuscular Fat) Reflects differences in 365 day adjusted intramuscular fat measured over the 12th and 13th rib in live cattle using ultrasound. (Angus, Charolais [included in marbling EPD] Limousin and Hereford.)
ME (Maintenance Energy) Differences in mature cow maintenance energy requirements based on megacalories expended per month. (Red Angus.)
MARB, MB (Marbling) 365-day adjusted marbling score measured in USDA marbling degrees. Primary factor in USDA quality grades. (Angus, Brahman, Brangus, Charolais, Gelbvieh, Limousin, Red Angus, Simbrah and Simmental.)
MH (Mature Height)-Measured in inches-is a predictor of the difference in mature height when comparing daughters of two sires. (Angus).
MW (Mature Weight) Measured in pounds A predictor of the difference in mature weight when comparing daughters of two sires. (Angus.)
M &G, TM, MWW (Milk and Growth, Total Maternal, Maternal Weaning Weight) Measure of a sire's ability to transmit milk production and growth rate through his daughters. It predicts the total weaning (direct and maternal) that will be displayed in his daughters offspring. It is calculated by summing half of the weaning weight EPD with the milk EPD ([1/2 WWEPD] + MWW EPD). Can be calculated for all breeds participating in NCE.
REA, RE (Ribeye Area) Rib eye area measured in square inches between the 12th/13th rib and adjusted to 365 days. A good predictor of total amount of muscle in the carcass and highly related to carcass weight. (Angus, Braham, Brangus, Charolais, Gelbvieh, Limousin, Red Angus, Simbrah and Simmental.)
%RP (Percent Retail Product) Predicts the difference in pounds of saleable retail product between different sire's progeny. (Brahman.)
SC, SCR (Scrotal Circumference) Predictor of sperm-producing tissue as measured in centimeters. Scrotal circumference is highly related to age at puberty in male and female progeny. (Angus, Brangus, Beefmaster, Charolais, Gelbvieh, Hereford and Limousin.)
SHR (Shear Force) A predictor of meat tenderness measured in pounds of force required to shear a steak. (Brahman and Simmental.)
STAY, ST (Stayability) Predicts the probability that a sire's daughters will remain in the herd until at least six years of age. This measures a cow's ability to remain in the cow herd, thereby involving reproductive efficiency, structural soundness, easy keeping ability as well and growth parameters in her offspring. (Gelbvieh, Limousin, Red Angus and Simmental.)
UFAT (Scan Fat, Ultrasound Fat) Backfat thickness measured over the ribeye at the 12th/13th rib using ultrasound imaging (Angus, Brangus, Charolais and Hereford.)
YG (Yield Grade) Expressed as a deviation of yield grade units where negative values are desirable. As an example, a bull with a -.50 YG EPD would be expected to sire calves ½ of yield lower (better) than a bull with a 0 YG EPD. (Limousin, Simbrah and Simmental.)
EPD Accuracy Value
EPDs that are calculated between sire summary analyses are given a value of interim or pedigree estimates depending on how much information is incorporated into the calculation of the EPD. Registration papers usually have these types of accuracies associated with EPDs printed on the certificate.
I (Interim EPD Accuracy) Accuracy value given to an EPD that was calculated using an individual's performance information and/or the EPDs of its parents and relatives.
P, PE (Pedigree Estimate) Accuracy value given to an EPD that was calculated summing the parents' EPDs then dividing by two (PE EPD = (EPDs +[EPDd]/2).
April 2006


