


Positive Outlook for Irish Cattle in 2012
Cattle prices in 2011 for all animal age categories have been substantially higher than in 2010, and this has led to an increase in the value of cattle production on Irish farms, write James Breen and Kevin Hanrahan in their cattle outlook for 2011/12.Introduction
The impact of higher output prices on margins more than offset the higher cost of concentrate feed and fertiliser. Average gross margins on cattle production systems are estimated to have increased in 2011 relative to 2010; however the prevalence of negative market-based net margins on Irish cattle production systems is estimated to have persisted in 2011. The outlook for cattle markets in 2012 remains positive with prices expected to remain well above 2010 levels. The supply of finished cattle in Ireland and the UK is expected to remain tight in 2012. The on-going contraction in the EU cow herd is expected to lead to a lower indigenous EU beef supply. This factor, combined with an international supply capacity that is not expected to grow significantly in 2012, points to a relatively stable price outlook. However, the demand side within the EU remains particularly uncertain. A second EU wide recession as a result of the ongoing EU debt crisis would negatively affect EU demand for beef and almost certainly lead to lower cattle prices in 2012.
Unless stated otherwise, all figures referred to in this paper are in nominal terms and all income and profit estimates exclude the value of decoupled income support payments.
Review of the Economic Performance of Beef Farms in 2010
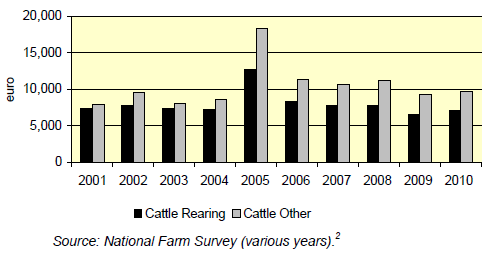
The trends in average family farm income (FFI) for the two main classifications of cattle farms in the Teagasc NFS over the period 2001 to 2010 are shown in Figure 1. In 2010 the average FFI on cattle rearing and other cattle farms had increased slightly compared with 2009 levels but still remained well below 2008 levels. The FFI on cattle rearing farms increased by 7 per cent when compared with the 2009 level while FFI on Other Cattle farms was 4 per cent higher, however despite this increase the average FFI on both farm types still remains low at only €7,023 and €9,676 respectively.
Figure 1 also illustrates that the divergence between the average FFI earned on farms in the cattle rearing system and the average income earned on the cattle other system that emerged post decoupling has been maintained. In 2001 the difference in average FFI between cattle rearing and cattle other farms was €500. By 2010 the difference in average family farm incomes earned on these two cattle farm types had grown to over €2,600. As noted in Breen and Hanrahan (2010) this divergence is a consequence of the decoupling of direct payments and the negative impact of this decision on the prices of weanlings and store animals sold by cattle rearing enterprises. The positive impact of decoupling on the income of those farms purchasing and finishing these animals, who paid lower prices for cattle purchased in, is also reflected in the higher FFI on the cattle other system.
Figure 1: Family Farm Income on Cattle Rearing and Cattle Other Farm Systems: 2001 to 2010
Specialist cattle farms, as defined by the NFS farm typology, accounted for approximately 55,400 farms or almost 56 per cent of the NFS farm population in 2010. However, there were a further 33,300 non-specialist cattle farms, i.e. farms with a cattle enterprise that accounted for less than 60 per cent of standard gross output. In total 88,700 farms or 89 per cent of the population of farms surveyed by the NFS in 2010, had a cattle enterprise on their farm. Thus, cattle production is by far the most prevalent agricultural enterprise on Irish farms. Given the large number of Irish farms with a cattle enterprise and the large variation that exists between the cattle systems operated, a high degree of variation in output and costs between farms can be expected.
There is considerable heterogeneity in Irish beef production systems. However, as noted earlier, many farms that are not classified as cattle farms under the NFS farm typology have a beef enterprise. All farms, both specialist cattle and non-specialist cattle farms, with greater than 5 cattle livestock units are included in this analysis. In Section 2 we analyse the economic performance of Irish cattle production in 2010 by classifying these farms on the basis of their dominant cattle system. In sections 3 and 4 we present the estimated net margin performance of Irish cattle farms in 2011 and the forecasted net margin performance for 2012 respectively. Net margin is calculated as gross margin less overhead costs. The allocation of overhead costs (sometimes referred to as fixed costs) to different enterprises on a farm is done on the basis of the enterprise share of farm gross output in 2010.
Comparison of Alternative Beef Production Systems in 2010
This section discusses the cost structure for four of the more common categories of beef production systems prevalent in Irish agriculture: single suckling (SS), cattle reared on dairy (RD), weanling to store/finish (WF) and store to finish (SF). We have categorised each of the four cattle enterprises analysed on the basis of gross margin per hectare and broken these sets of farms into three equally sized groups which we have termed farms with least, average and most profitability.
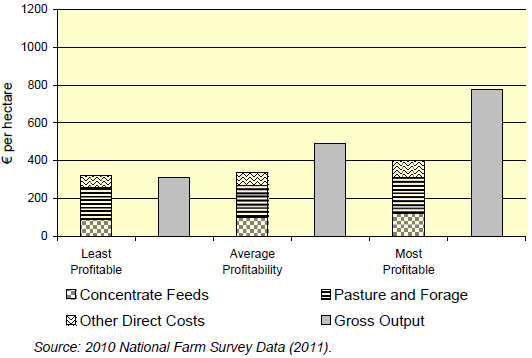
Single Suckling (SS): In 2010 the average direct cost of production per hectare (ha) for SS beef systems ranged from €322 per hectare on those farms with lowest average gross margin to €399 per hectare on the most profitable farms (see Figure 2 below). The cost of concentrate feed along with the cost of pasture and winter forage typically accounts for 80 per cent of the direct costs of production on SS farms. The average expenditure on concentrate feed varied from €92 per hectare on the low profitability farms to €121 per hectare on the high profitability farms. There was considerably more variability in the average gross output between the least profitable and most profitable farms. The most profitable third of SS farms earned an average gross output of €777 per hectare compared with an average gross output of €313 per hectare on the least profitable farms. This variability in average gross output is in part due to a higher stocking on the more profitable farms. The highest profitability farms had an average stocking rate of 1.52 livestock units (LU) per hectare compared with only 0.94 LU per hectare for those farms with the lowest profitability.
Figure 2: Variation in Total Production Costs and Gross Output on Single Suckling Beef Farms in 2010
Cattle Reared on Dairy Farms (RD): The second production system analysed involves the rearing of cattle born on the farm to a dairy herd. There are a number of points to note when comparing the RD production system with the SS system. First, while the average gross output earned on RD farms is significantly larger than that earned on SS farms, this is associated with higher average direct costs of production. These higher gross output and costs of production per hectare on RD farms are largely due to the higher stocking rate on these farms when compared with SS farms. The average stocking rate on the RD farms in 2010 was approximately 1.86 cattle LU per forage hectare compared with between 1.2 and 1.3 LU per forage hectare for the other three cattle systems examined.
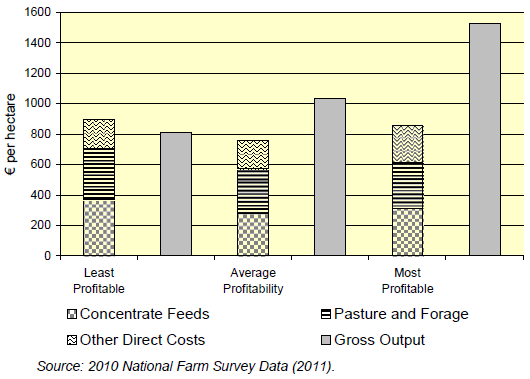
Average direct costs of production were lowest on those RD farms with average profitability (€760 per ha) and highest on the least profitable farms (€896 per ha) (See Figure 3 below). Total expenditure on concentrate feed is substantially higher on RD farms than on SS farms. The high expenditure on concentrate feed is due in part to the earlier weaning of calves on dairy farms and the fact that, other things being equal, finishing dairy cross cattle generally requires higher volumes of concentrate feed per animal than would be required for non-dairy cross animals. Other direct costs are also substantially higher on RD farms this is in part due to the cost of milk and milk substitutes that are fed to calves. While the expenditure on concentrate feed and other direct costs on RD farms are double the level on SS farms, expenditure on pasture and winter forage on RD farms is somewhat closer to the level of expenditure on SS enterprises. The most profitable one third of RD farms had a gross output of €1,526 per hectare compared with €812 per hectare on the least profitable farms.
Figure 3: Variation in Total Production Costs and Gross Output on Cattle Reared on Dairy Farms in 2010
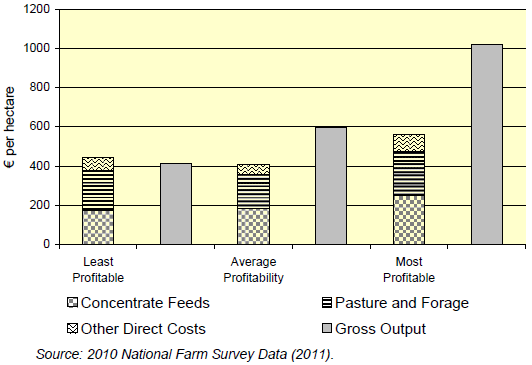
Weanling to Finish (WF): There is a considerable degree of variability in the direct costs of production on farms specialising in buying weanlings which are either sold as finished animals or sold as stores (WF). Total direct costs of production are lowest on those farms with average profitability levels (€410 per ha). A considerable proportion of the variability in direct costs is due to differences in expenditure on concentrate feeds (see Figure 4). Those farms which earned the highest gross margin per hectare also had the highest direct costs of production in 2010, however these higher direct costs were more than offset by the high gross output earned on these farms. The most profitable farms had an average gross output of €1,018 per hectare compared with only €411 per hectare for the least profitable farms. The average stocking rate on the most profitable farms was 1.51 LU per hectare compared with only 1.1 LU per hectare for the least profitable farms.
Figure 4: Variation in Total Production Costs and Gross Output on Weanling to Store/Finish Beef Farms in 2010
Store to Finish (SF): The final system examined is the store to finish system (SF), in which animals are purchased as stores and brought to finish. Those farms in the most profitable one third are typically operating a more intensive system than the farms in the other two groups. The average stocking rate on the most profitable one third of farms is 1.6 LU per hectare compared with only 0.99 LU per hectare for the least profitable farms. Similarly the most profitable farms finished an average of 90 animals per farm in 2010 this compares with an average of only 30 animals per farm for the least profitable group. As with the WF farms, expenditure on concentrate feed on SF farms is more variable between farms operating this system than expenditure on pasture and winter forage. As illustrated in figure 5 below concentrate feed expenditure on SF farms in 2010 ranged from an average of €243 per hectare on the most profitable farms, to less than €96 per hectare on the average profitability farms. Again this variability in expenditure per hectare is in part due to the differences in average stocking rate between farms.
Figure 5: Variation in Total Production Costs and Gross Output on Store to Finish Beef Farms in 2010
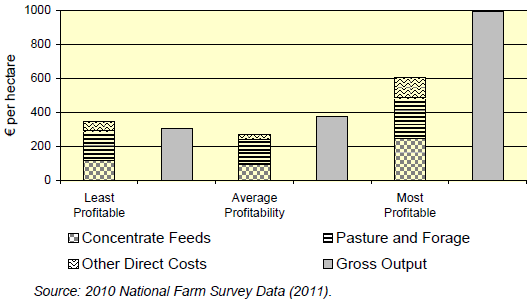
The results presented highlight the large differences in costs per hectare on what we have termed least, average and most profitable farms. However, it is important to recall that there are also substantial variations in gross output across farms, and that high levels of gross output per hectare are often associated with high levels of direct costs of production.
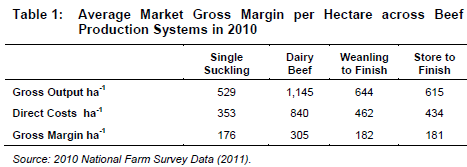
Table 1 summarises the average direct costs, gross output and gross margin across each of the four production systems on a per hectare basis. The highest average gross margin per hectare in 2010 was earned on the RD farms, where the average market based gross margin was €305 per hectare. The SF farms had an average gross margin of €181 per hectare, while the SS and WF farms earned average gross margins of €176 and €182 per hectare respectively.
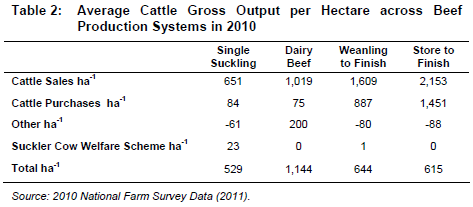
As well as looking at total gross output, it is also important to consider the components of gross output and how these change between systems of production. Table 2 below shows the main components of gross output on the four types of cattle enterprises analysed using NFS data. While the value of total cattle sales on WF and SF farms are higher than on SS and RD farms the WF and SF farms also incur a substantial cost in acquiring the cattle as shown by their cattle purchases per hectare. In contrast average cattle purchases per hectare on SS and RD farms are quite low as these farms are predominantly engaged in the rearing of animals born on the farm. The Suckler Cow Welfare Scheme continues to be an important source of income for farms in the SS category but makes only a negligible contribution to average gross output on the other three cattle systems. The “Other” component includes change in stock value, as well as the value placed on animals transferred from the dairy herd to the beef herd and the value placed on animals transferred from the beef herd to the dairy herd, i.e. replacement dairy heifers. Other things being equal an equivalent positive and persistent shock to calf, weanling, store and finished cattle prices would be expected to affect the four systems differently. Enterprises where both the price of cattle purchased in and sold out increases would be less affected than systems based predominantly on rearing cattle born on the farm.
Comparison of Returns to Cattle Production
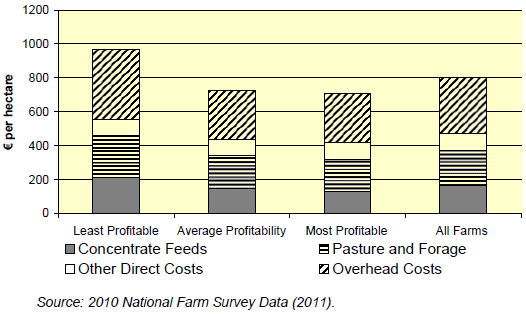
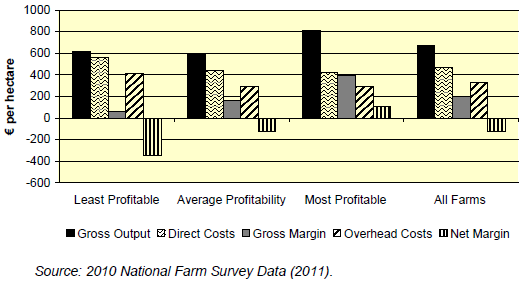
When comparing the costs of cattle production between groups of farms organised on the basis of net margin per hectare there is a considerable degree of variability between the least profitable one third of cattle farms and the other two thirds of cattle farms. The average total cost of production on the least profitable one third of cattle farms in 2010 was €968 per hectare, which was more than 30 per cent higher than the average cost of production per hectare on the other two thirds of cattle farms. As we can see from Figure 6, differences in expenditure on concentrate feed accounts for a large share of the difference in total costs between Irish cattle farms. The least profitable farms on average spent €216 per hectare on concentrate feeds in 2010, compared with €148 and €131 per hectare for the average and most profitable farms respectively. Average expenditure on pasture and winter forage on the least profitable cattle farms was also higher than on the farms with average and above average levels of profit per hectare. The other major difference in costs between the least profitable third of cattle farms and other cattle farms arises from the level of overhead or fixed costs. On the least profitable farms these costs amounted to €411 per hectare, 42 per cent higher than the level on the most profitable one third of beef farms.
Figure 6: Variation in Total Production Costs for all Cattle Farms in 2010
While the mean costs of production on the average and most profitable cattle farms are roughly similar, the difference in their profitability arises from differences in the value of gross output on these two groups of farms. As shown in figure 7, the average gross output on the most profitable one third of cattle farms in 2010 was €810 per hectare, compared with an average gross output of €618 per hectare for the least profitable farms.
The average gross margin on the most profitable farms was €392 per hectare, while the average gross margin on the least profitable one third of Irish cattle farms was €61 per hectare. In 2010 only the most profitable third of farms with a cattle enterprise on average earned a positive net margin from cattle production, with an average net margin of €102 per hectare. The least profitable one third of Irish cattle farms in 2010 earned on average a negative net margin of €350.
Figure 7: Variation in Output, Costs and Net Market Margin per hectare for all Cattle Farms in 2010
Estimated Performance of Irish Cattle Farms in 2011
This section of the paper presents a review of the economic performance of Irish cattle farms in 2011. A discussion of the estimated changes in input usage and input costs in 2011 is first presented and this is followed by a discussion of estimated changes in output value. The estimates of margins earned by the different cattle enterprises in 2011 are then presented.
Estimated Input Usage and Price 2011
Feedstuffs
At the time of writing (December 2011), three quarterly bulletins of official Department of Agriculture, Food and the Marine (DAFM) data on the quantity of meals fed to the beef herd were available for 2011. For the first nine months total beef feed use was approximately 6 per cent lower than for the equivalent period in 2010. Assuming the quantity of concentrate feed purchased for the final three months of 2011 is similar to the level for the corresponding period in 2010, then a total reduction in the volume of feed purchased of 3 per cent can be expected relative to the 2010 levels.
Figure 8 presents the monthly price index for cattle feed stuffs for the years 2006 to 2011. Cattle feed prices started to decline in late 2009 and remained relatively low in early 2010. A reduction in the volume of cereals traded internationally led to an increase in global cereal prices in the second half of 2010. This was reflected in Irish cattle feed prices which started increasing again from August 2010 onwards. By the end of 2011 cattle feed prices were back to a level similar to that paid in 2008. Cattle feed prices in 2011 are estimated to have been 16 per cent higher on average than in 2010.
Figure 8: Monthly Price Index of Cattle Meal in Ireland 2006 to 2011
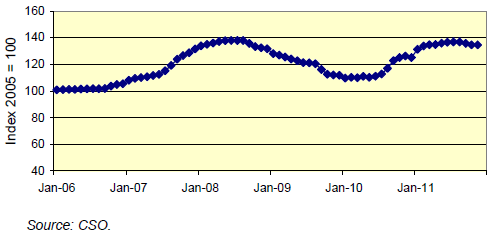
With volumes fed anticipated to have fallen by 3 per cent and the average feed prices having increased by 16 per cent, this is equivalent to an increase of 12.5 per cent in the total expenditure on feed by beef farmers in 2011 compared with 2010.
Fertiliser – usage and price 2011
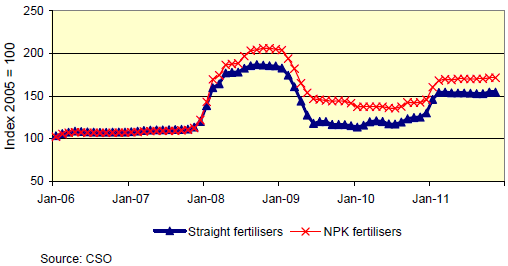
Figure 9 presents the change in fertiliser prices over the past five years. After declining significantly in 2009, fertiliser prices remained relatively stable for most of 2010 before starting to increase again in late 2010 and early 2011, and remained high throughout 2011. The bulk of the fertiliser purchased for the cattle system is likely to have been purchased in the first six months of the year at a time when fertiliser prices were more than 20 per cent higher than for the corresponding period in 2010. Overall the cost of fertiliser is estimated to have increased by 25 per cent in 2011.
Figure 9: Monthly Price Index of Fertiliser in Ireland from 2006 to 2011
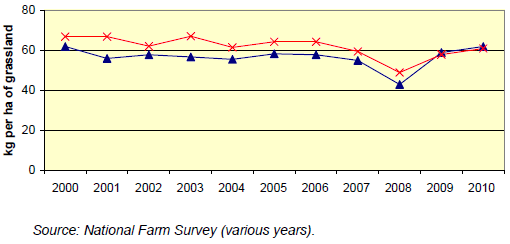
Data from the DAFM indicate that there was a small decrease in total sales of nitrogen, phosphorous and potassium in 2011 compared with 2010. Sales of nitrogen were down 5 per cent in 2011, while sales of phosphorous and potassium were 2 per cent and 3 per cent lower respectively. As can be seen in Figure 10 below average fertiliser application on specialist drystock farms is typically quite low and year on year changes in fertiliser application rates also tend to be small. It is estimated therefore that in 2011 average fertiliser application rates have declined by 5 per cent.
Figure 10: Nitrogen Fertiliser Application on Specialist Cattle Farms 2000-2010
Given an increase in the fertiliser price of 25 per cent and a reduction in the volume of fertiliser purchased of 5 per cent, the overall expenditure in 2011 on fertiliser by Irish cattle farms is estimated to be up by almost 19 per cent.
Energy and Fuel – usage and price 2011
2011 has seen crude oil prices increase from $92 per barrel (pb) on average in Jan 2011 to almost $110 pb in December 2011. The average price for 2011 was €108 pb. Over the course of 2011 the euro strengthened versus the US dollar and as a result the extent of the per centage and absolute crude oil price increase relative to 2010 was smaller when expressed in euro terms. The average crude oil price for 2011 in euro was €77 pb, an increase of 33 per cent on the 2010 value of €58 pb. A carbon tax was introduced by the Irish Government in mid 2010 and this also increased fuel prices paid by Irish farmers. Overall, diesel costs in Ireland are estimated to have increased by 18 per cent when compared with their 2010 level.
With the increase in diesel prices in 2010 it is anticipated that contracting charges will also have increased somewhat. Fuel related costs account for about 25 per cent of total contracting costs. The other components of contracting costs are assumed to have remained largely unchanged and therefore it is estimated that contracting costs in 2011 have increased by 4.5 per cent compared with 2010. Given that most of the contractor work on cattle farms involves making silage and applying farmyard manure and artificial fertiliser, there is very little scope to change the “volume” of contractor services consumed. Consequently, no change in volume of contractor services used is assumed and therefore the estimated 5 per cent increase in price is reflected in an increase in expenditure on contract work.
Electricity costs change infrequently in Ireland due to price regulation. The most recent price change was an increase in October 2011. On an annual average basis this means that prices have risen by about 5 per cent in 2011, relative to 2010. Given that no change in volume consumed is assumed to have occurred in 2011, expenditure on electricity on cattle farms is estimated to have increased by 5 per cent in 2011 relative to 2010.
All Other Direct and Fixed Costs– usage and price 2011
Agricultural wages in Ireland are estimated to have increased by 1 per cent between 2010 and 2011, while the quantity of labour used on farms is assumed to have remained unchanged. Therefore we estimate that the expenditure on hired labour used by Irish cattle farms has increased by 1 per cent in 2011. Other direct costs include the value of milk and milk substitutes fed to calves and this cost is estimated to have increased significantly in line with the general increase in milk prices seen in 2011. We have assumed an increase of 13 per cent in this line of expenditure. The cost of other overhead (fixed) costs is estimated to have remained largely unchanged. Given the nature of overhead costs, there is little capacity for changes in volume used, and therefore no change in expenditure on other fixed costs is assumed in 2011 compared to 2010.
Estimate of Direct Cost Expenditure for 2011
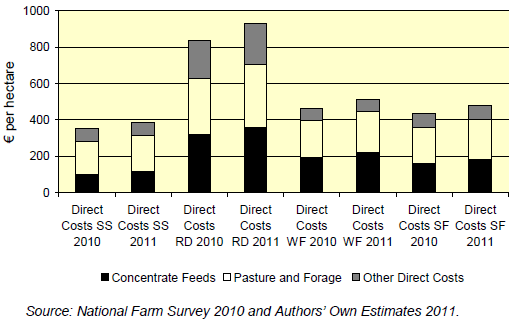
Figure 11 compares the average direct costs of production for the four featured production systems in 2010 with the estimated direct costs for 2011. Average direct costs are estimated to have increased across all four of the production systems examined. The main drivers of this increase in direct costs of production in 2011 are the higher prices for concentrate feed and fertiliser in 2011 compared with 2010. The increase in the value of milk fed to calves also led to a greater increase in the other direct costs per hectare on RD farms. Overall, the total direct costs on SS farms are estimated to have increased by €35 per hectare between 2010 and 2011 while total direct costs on the SF farms is estimated to have increased by €46 per hectare.
Figure 11: Comparison of Actual 2010 Direct Costs and Estimated 2011 Direct Costs for main Cattle Systems
Estimated Output Values 2011
Ireland exports over 80 per cent of its beef production and is the fifth largest exporter of beef in the world. The export dependence of the Irish beef industry means that external market developments largely determine Irish cattle prices. Thus, conditions in the particular overseas markets to which Irish beef and cattle are exporting play an important role in determining Irish cattle prices. The past year (2011) has been a particularly good year for the Irish cattle industry in terms of prices achieved, with prices for all of the main cattle types up considerably on 2010 levels.
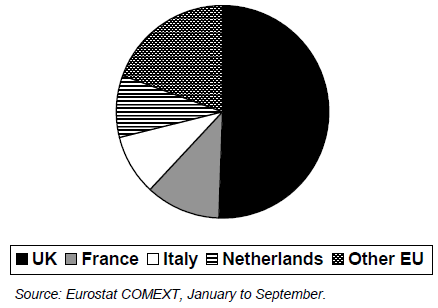
The UK remains by a significant margin the largest market for Irish beef (see Figure 12). The end of the recession in the UK has led to some weak recovery in demand for beef in the UK, while the stronger economic performance of most other EU Member States has also been reflected in some recovery in beef prices during 2011. The export of beef to non-EU markets such as Turkey in 2011, which reduced the tariffs it places on imports of beef in response to large increases in internal prices in 2011, and the continuing restrictions on imports of beef into the EU from Brazil were also contributing factors to higher EU and Irish cattle prices in 2011.
Figure 12: Irish Beef Export Markets (Volume) 2011
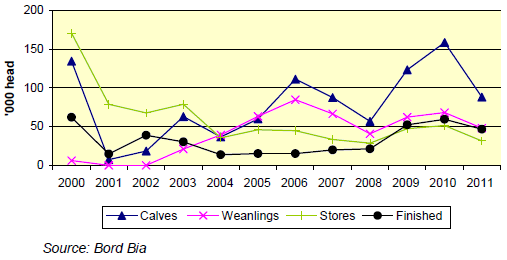
Live exports for all four of the main cattle types were down in 2011 compared with their 2010 level reflecting the degree to which Irish cattle prices increased relative to prices elsewhere in the EU (See Figure 13 below). Total live exports in 2011 were almost 124,000 head lower than in 2010 with the biggest reduction being in the number of calves exported.
This reduction in live exports of cattle from Ireland is unsurprising given the buoyant nature of the Irish cattle industry in 2011.
Figure 13: Total Live Cattle Exports 2000 to 2011
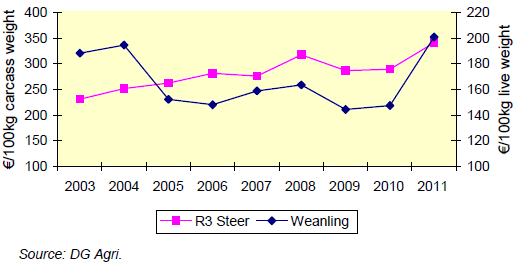
In 2011 Irish cattle prices increased significantly relative to 2010, Figure 14 presents average steer and weanling prices for the period 2003 to 2011. Finished cattle prices (R3 steer) increased by almost 18 per cent to an average of €341 per 100kg. The price of weanlings has increased by more than 35 per cent in 2011 while the price for store animals is approximately 20 per cent higher in 2011 than in 2010.
Figure 14: Irish Cattle Prices 2003 to 2011
Irish and EU Cattle Supply
In the short term, indigenous EU supplies of beef are contracting due to the ongoing reductions in the EU dairy cow herds. The EU suckler cow herd has remained largely stable due to the retention of coupled direct payments. The ongoing contraction in EU supply, together with a world market that is expected to be characterised by strong and stable prices in 2012 is expected to lift EU beef prices in 2012 above the levels observed in 2011. As noted earlier uncertainty and the risk of a renewed recession within the EU and possibly globally, represents a significant downside risk to Irish and EU cattle prices.
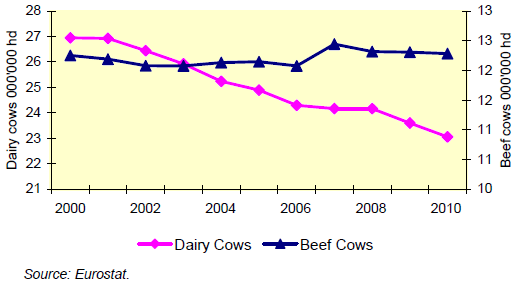
In Figure 15, the recent trends in dairy and other cow stocks in the EU are presented. Over two-thirds of EU beef production is based on the offspring of dairy cows. To date the contraction in the dairy cow herds has exceeded that in the other (beef) cow herd, leading to a modest increase in the share of the EU cow herd that is non-dairy. Low returns from cattle production have led to some contraction in suckler cow numbers in the UK and Ireland and though the rate of contraction is expected to slow due to improved cattle prices and the introduction of measures such as the suckler cow welfare scheme, the size of the suckler cow herd is not expected to grow significantly.
Figure 15: EU Cow Numbers (December) 2000 - 2011
Beef System Net Margins Estimates for 2011
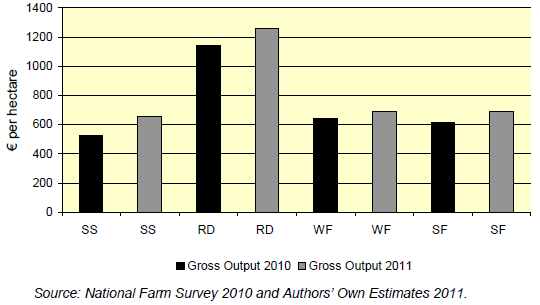
Average gross output on all four of the selected beef production systems is estimated to have increased in 2011. This increase is due to the substantially higher prices for cattle in 2011. Despite an increase of approximately 17 to 18 per cent in the value of finished cattle the increase in gross output on the WF and SF farms is estimated to be approximately 7 and 12 per cent respectively. As shown in Table 2 the cost of younger animals purchased is a substantial (negative) component of the gross output on these farms and therefore the increase in the cost of these younger animals has eroded some of the gains from the higher prices for finished animals. In contrast, the value of purchased animals is a relatively small component of gross output on the SS farms and as a result these farms have seen a greater increase in the value of their gross output. The largest increases in output occurred on the SS farms with an increase in gross output of €129 or 24 per cent (See Figure 16 below).
Figure 16: Comparison of Actual 2010 Gross Output and Estimated 2011 Gross Output for main Cattle Systems
As shown in Table 3 the cost of fertiliser and concentrate feed are both estimated to have increased substantially in 2011. In the case of the SS, RD and SF farms this is more than offset by the increase in gross output, however in the case of the WF farms the average gross margin is estimated to remain largely unchanged. The increases in the average gross margin on the SS, RD and SF farms leads to an improvement in the estimated net margin per hectare for these production systems. However a reduction in the average net margin per hectare for WF farms is estimated.
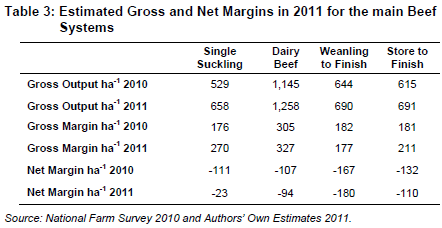
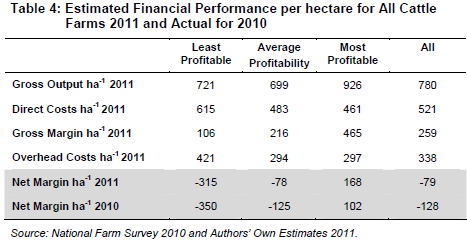
Table 4 breaks the cattle farm population into 3 equal parts on the basis of profitability (net margin) per hectare. For the least profitable third of cattle farms the average negative net margin is estimated to have improved from -€350 per hectare to -€315 per hectare. In 2010 the average net margin on the most profitable one third of Irish cattle farms was €102 per hectare; in 2011 this is estimated to have increased to €168 per hectare.
Outlook for 2012
In this section we forecast the expenditure for various input items, the beef price that is expected to prevail in 2012 and the likely income of beef farmers in 2012.
The Outlook for Input Expenditure
Feedstuffs
The 2011 harvest prices for cereals in Ireland were estimated to have increased by 11 per cent compared with the 2010 harvest price (Thorne, 2011). Therefore farmers purchasing animal feed early in 2012 can expect to pay a higher price than for the corresponding period in 2011. However, it is forecasted that the cereals price in 2012 will be 12 per cent lower than the 2011 cereal price. An overall decrease in cattle feed prices of 8 per cent is forecast for 2012 compared with 2011. Given our forecast reduction in feed prices we expect an increase in the volume of concentrate feed fed in the region of 3 per cent in 2012. Overall, this leads to a forecast reduction in concentrate feed expenditure of 5.2 per cent in 2012 relative to 2011.
Fertiliser
The end of 2011 has seen a considerable degree of movement in global fertiliser prices, due to higher energy prices and relatively fixed fertiliser supplies. Therefore, farmers purchasing fertiliser in early 2012 can expect to pay more than they did in the corresponding period last year. An average price increase of 7 per cent is forecast with no reduction in volume purchased assumed. As a result total expenditure on fertiliser is forecast to be 7 per cent higher in 2012 than in 2011.
Energy and Fuel
In 2011 crude oil and natural gas prices increased and markets expect that oil exporting countries will adjust supply to try to maintain crude oil prices close to US $100 in 2012. In December 2011 the average crude oil futures price for 2012 was $100 pb or approximately €76 pb. This is equivalent to a price decrease of about 1 per cent compared with 2011. Specific Irish inflationary pressures also will arise from the increased carbon levy and VAT on fuel. A weakening of the euro versus the US dollar could arise and this would add to fuel inflation, however on balance we do not expect an increase in the annual average price of farm diesel in 2012 relative to the average for 2011.
The cost of electricity is also expected to increase on 2012 levels by 5 per cent relative to the 2011 level.
Other Direct and Fixed Costs
Increases in the cost of labour and in general inflation are likely to be low given the ongoing weakness in the Irish economy. An increase in labour costs of 1 per cent with no volume change is assumed. We forecast that other direct costs will increase by 1 per cent, while the value of milk fed to calves is forecasted to fall by 7 per cent. Other overhead (fixed) costs will remain unchanged relative to their 2011 level in 2012.
The Outlook for Cattle and Beef Markets 2012
The price of Irish cattle and beef showed a significant improvement in 2011 compared with 2010. Given the uncertain and weak macroeconomic outlook for the EU further cattle price increases are not expected and so a marginal reduction in cattle prices of 2 per cent is anticipated.
The Outlook for Beef System Net Margin in 2012
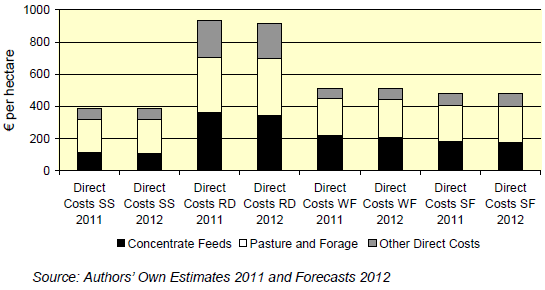
Figure 17 compares the estimated and forecast average direct costs per hectare in 2011 and 2012 for the four featured beef production systems. The forecast decrease in expenditure on concentrate feed is likely to be largely offset by higher pasture and winter forage costs as a result of higher fertiliser prices. As a result, it is expected that total direct input cost expenditure will be largely unchanged on SS, WF and SF farms. However RD farms are forecast to show a reduction in total direct costs of €14 this is in part due to a reduction in the value of milk fed to calves.
Figure 17: Comparison of Estimated Direct Costs for 2011 and Forecast Direct Costs for 2012
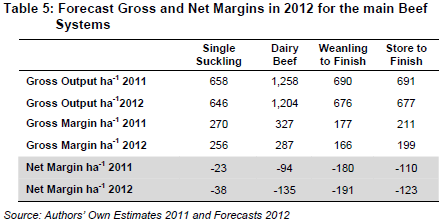
As can be seen in table 5 below, the average gross margin for each of the four cattle systems is forecast to decrease slightly in 2012. With little change expected in total direct costs of production, a reduction in average gross margin is forecast due to the expected reduction in cattle prices. The forecast reduction in the average gross margins ranges from €11 to €39 per hectare. As a result of reduced average gross margins and modest increases in overhead costs the average net margin earned by all four production systems is forecast to be lower than in 2011.
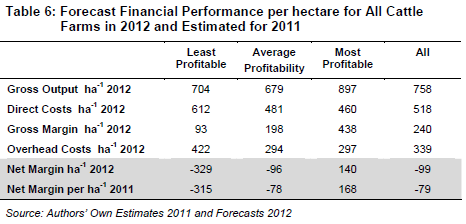
Overall the average net margin per hectare for all cattle farms in 2012 is forecast to be -€99 compared with -€79 per hectare in 2011. As shown in Table 6 the net margin on the most profitable farms is forecast to decrease from an estimated €168 per hectare in 2011 to €140 per hectare in 2012.
Concluding Comments
their 2010 levels. However, the price for calves and weanlings increased by more than the price for older cattle. As a result the increase in gross output was smaller on those farms purchasing younger cattle. The expenditure on concentrate feed and pasture and winter forage also increased in 2011 as a result of higher concentrate feed prices and higher fertiliser prices. On average cattle net margins in 2011 improved by €49 per hectare compared with 2010, however only the top one third of farms earned a positive market based net margin.
Cattle prices are forecasted to remain strong in 2012 with only a modest decline from the high prices observed in 2011 forecast. This decline in cattle prices is likely to coincide with some relief from lower feed prices, but this will be more than offset by higher prices for fertiliser, and modest increases in other direct costs, hired labour and energy prices. Overall this is forecast to lead to a reduction in average net margins per hectare for all cattle farms in 2012, with only the top one third of cattle farms earning a positive market-based net margin from cattle production in 2012.
References
Breen, J. and Hanrahan, K. (2010) Situation and Outlook for Cattle 2009/10.
Hennessy T, Moran B, Kinsella A, and Quinlan G (2011) National Farm Survey 2010. Teagasc, Rural Economy Research Centre Athenry Ireland. Available to download at http://www.teagasc.ie/publications/view_publication.aspx?Publicatio nID=1016
CSO (2011) Agricultural Price Indices: Preliminary Estimates 2010. Statistical Release. Available on www.cso.ie.
DAFM (2011) Quarterly Summary Report for Feed Usage (Various Issues).
Further Reading
| - | You can view the report by clicking here. |
January 2012

