

The Reform Of CAP - Issues For Beef Producers
At the 2011 Teagasc Beef conference, Dr Tom Kelly and Dr Frank O’Mara, Teagasc Oak Park look at the issues that a CAP reform presents for beef producers, considering that cattle farmers' incomes are hugely dependent on direct payments.Introduction
The current EU budget period finishes at the end of 2013. The CAP reform will be agreed next year or at the very latest during 2013. Period of implementation of the agreed reforms may be into 2014/15. If there is a radical reform then the process may take even longer. There has been a consultation phase over the last 2 years, this has raised issues which are likely to shape the reformed CAP.
The reform of CAP has been ongoing and necessary due to changes in EU policy and now in particular with a larger EU membership and new issues of climate change, limited fuel and world demand for food. We have seen the change from price supports to headage and decoupled payments with built in cross compliance and channelling of funds toward targeted rural development. This reform of CAP is part of the larger EU budget review, given the size of agriculture in the EU budget at circa 40 per cent.
The European Commission are saying that they will support a new, reformed CAP, which supports the more efficient production of a wide variety of quality food products provided that they are in demand and that in their production benefits of social and environmental public goods are evident.
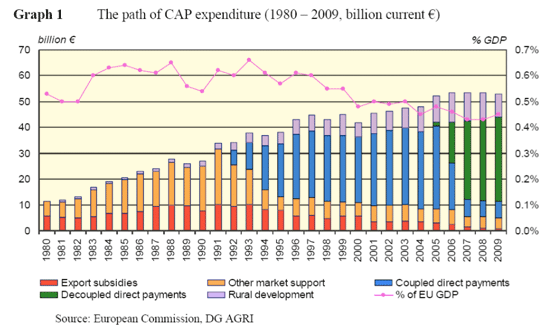
CAP Expenditure has changed significantly with each Reform
Graph 1 illustrates the evolution in nominal CAP expenditure from 1980 to 2009. It also shows that CAP expenditure relative to EU GDP has declined to close to 0.45 per cent in 2009. The change in the nature of CAP expenditure is also apparent. Earlier reforms reduced the importance of market support and export subsidies and led to increased expenditure on coupled direct payments. Recent reforms have seen decoupled income supports increase in importance together with expenditure on rural development.
While the overall expenditure on CAP appears to have increased dramatically in nominal terms, this does not reflect the discounted value of money or the expansion of the EU since 1980: 1981 (Greece); 1987 (Spain and Portugal); 1995 (Austria, Sweden, Finland); 2004 (Latvia, Lithuania, Estonia, Poland, Czech Rep., Slovakia, Hungary, Slovenia, Malta, Cyprus) and in 2007 (Romania and Bulgaria).
Importance of the current CAP to beef production
The importance of direct payments to beef farmers is best looked at in the longer term. Prior to 1992, the major direct payments were the disadvantaged areas payments. These were equivalent to 8 per cent of the value of farm output in 1992. After the 1992 CAP reforms and reduction in intervention prices coupled premium and area aid systems were introduced to the beef and cereal and oilseed CAP commodity market organisations. The 1992 reforms sought to make the CAP more market orientated and aimed at preventing the accumulation of huge intervention stocks of beef and other agricultural commodities. The 1992 reforms also allowed the EU and the wider international community to conclude the Uruguay Round of Multilateral Trade Negotiations in 1993 that, for the first time, introduced restrictions on domestic agricultural policy and the barriers to trade in agricultural and food commodities. European dairy farmers continued to be supported by market intervention arrangements after the 1992 reforms. The Agenda 2000 CAP reform agreement in 1999 led to some reduction in market support of dairy production.
The 2003 CAP reform (Fischler) involved the decoupling of CAP direct payments from agricultural production. Ireland opted for full decoupling of payments and the use of the historic model, with the reference years of 2000, 2001 and 2002 used to establish the individual farmer single payment system (SPS) per hectare entitlements. The 2003 CAP reform introduced the idea of “freedom to farm” to the CAP, in allowing individual farmers to choose the system of farming that best suited their land, labour and capital endowment. Receipt of decoupled direct income support payments is conditional on the satisfaction of cross compliance requirements which set standards for environmental and animal welfare. Despite fears of major shifts in production and land abandonment, up to 2009 the vast majority of farmers continued to farm actively with little or only small changes in practices.
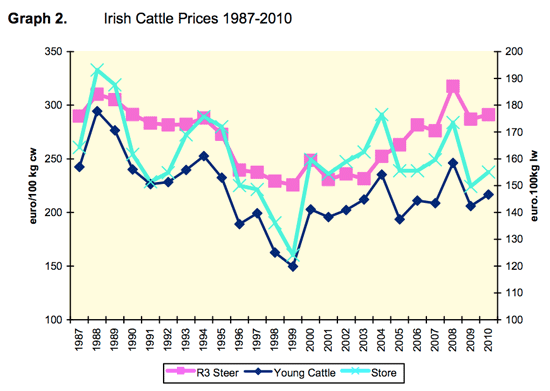
The value of direct payments to farmers grew from an average of €2,000 in 1990 to over €16,400 in 2006. Most farmers still look on these payments as price compensation rather than income support, so the payments are treated like any other farm output e.g. sale of produce or stock. Since decoupling there has been relatively steady increase in nominal finished cattle prices with more volatility in weanling and store prices. Graph 2.
To look closely at what has happened it is useful to use the National Farm Survey data 1990-2009 and see the growth in the proportion of farm gross output made up of direct payments (Table 1). This data shows the increased nominal direct payments and the increased proportion of output made up of direct payments move from market support to headage up to the 2000 reform and the relatively stable proportion of output since payments were decoupled.
Direct payments (DP) as a proportion of Gross Output and Family Farm Income FFI extracts from (NFS)
| Cattle Rearing | Cattle Other | All Farmers | |||||||
|---|---|---|---|---|---|---|---|---|---|
| DP € | % of G.O. | % of FFI | DP € | % G.O | % of FFI | DP € | % G.O. | % of FFI | |
| 1990 | 1,537 | 16 | 50 | - | - | 2,209 | 8 | 26 | |
| 1995 | 4,427 | 39 | 90 | 5,015 | 30 | 84 | 5,285 | 16 | 47 |
| 2000 | 9,202 | 48 | 129 | 9,610 | 41 | 136 | 9,431 | 25 | 74 |
| 2006 | 12,347 | 49 | 149 | 15,237 | 45 | 134 | 16,346 | 33 | 97 |
| 2009 | 13,396 | 52 | 204 | 15,437 | 47 | 166 | 17,109 | 35 | 143 |
The National Farm Survey data shows that since 2000 direct payment to cattle rearing and cattle other farmers have made up over 100 per cent of family farm income (FFI) and that the share in 2009 was 204 per cent of average family farm income on cattle rearing farms. The contribution of direct payments in output value and income in NFS survey average farm data is also reflected in the average performance of asample of more efficient beef farms (e-Profit Monitor farms) (Table 2). The contribution of direct payments to gross output is lower at about 40 per cent on average, compared to 45 to 50 per cent from NFS data for similar years. The Profit Monitor sample would be expected to be above average in efficiency and scale compared to the average cattle rearing and cattle other farms in the NFS.
Data extracted from “Increasing Your Profit” (e-Profit Monitor Report 2009)
| Year | Output €/ha | DP €/ha | DP % of output | Output Kg/ha | Output price per Kg Beef | Output price € / kg l.w. inc. DP |
|---|---|---|---|---|---|---|
| 2004 | 1,625 | 698 | 43% | 646 | 1.43 | 2.51 |
| 2004 | 1,5 | 655 | 41% | 619 | 1.49 | 2.55 |
| 2005 | 1,579 | 655 | 41% | 619 | 1.49 | 2.55 |
| 2006 | 1,640 | 656 | 40% | 628 | 1.57 | 2.62 |
| 2007 | 1,710 | 683 | 40% | 632 | 1.62 | 2.70 |
| 2008 | 1,849 | 714 | 39% | 609 | 1.86 | 3.04 |
| 2009 | 1,781 | 701 | 39% | 675 | 1.6 | 2.64 |
These analyses show an underlying problem of lack of profitability in cattle farming systems and despite the decoupling of payment farmers continue to use the payment to subsidise their farming systems. If there were more profitable uses for land, would farmers change and retain more of the income? Is there logic in saying that the existing CAP benefits the processor, retailer and consumer more than the farmer because of the attitude of farmers? It is difficult to justify the existing income support side of CAP if those who are meant to benefit cannot retain it.
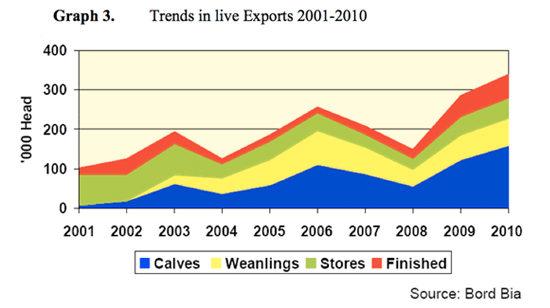
Against this background the CAP, which supported agricultural production in EU member states for over 50 years is now facing new challenges and must reflect these. These new reforms will affect cattle farmers and it is important that Irish farmers maintain a significant level of support, in particular, if the EU market is further opened up to cheap imports under the EU-Mercosur trade deal. Ireland is the major exporter of beef in Europe and is highly dependent on existing tariffs. Irish farmers are also dependent on live export to EU countries who have specialised markets (Graph 3). The impact of reform and trade deals will indirectly influence these live markets in the response of the farmers in other countries buying Irish calves and weanlings.
CAP Payments and the Dependence of Cattle vs. other farming systems
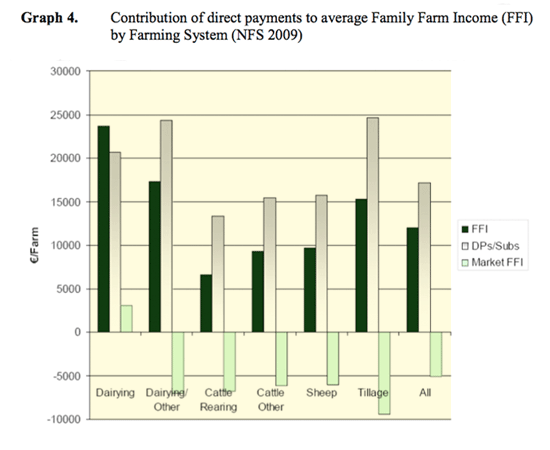
National Farm Survey results for 2007, 2008 and 2009 show that the value of direct payments to full time farms were greater than FFI on cattle rearing, cattle other and mainly sheep farm systems. In all years, FFI was greater than direct payment receipts on dairying farms. On mainly tillage and dairying and other farms in some years direct payments were greater than FFI, in others years direct payments were less. The dependence of FFI on part-time farms is even greater.
CAP payments and Farm efficiency
The proportion of individual farmers’ income made up from direct payments as effected by efficiency. Analysis of 2010 Profit Monitor shows that where suckler to weanling/store farms were ranked on gross margin/ha and the top third compared to the bottom third there a much higher proportion of direct payments retained as profit on the top 1/3 farms (Table 3). The results show that higher output/ha drive profitability and a higher proportion of direct payments retained. The authors accept that this is a biased sample, however it does point to the absolute need for best practice and high levels of efficiency. These farms clearly have similar costs per ha. but hugely differing output in terms of both kg live weight produced and in output value per ha.
Analysis of 2010 profit monitor (n=71)
| Top 33% | Average all | Bottom 33% | |
|---|---|---|---|
| Gross output €/ha -DP | 1102 | 839 | 602 |
| Variable costs €/ha | 558 | 513 | 517 |
| Gross Margin €/ha | 543 | 326 | 84 |
| Fixed costs €/ha | 461 | 411 | 389 |
| Net Profit €/ha | 82 | -84 | -304 |
| Direct payments €/ha | 690 | 631 | 608 |
| % direct payments retained | 112% | 87% | 50% |
The CAP and how it is Spent and Funded
The current CAP has two main components. Pillar I which is made up of income support and pillar II which is largely rural development supports. In Ireland this has been targeted at environmental schemes including REPS etc.
Pillar I: Income support: SPS Direct Payments.
In Ireland, these account for about €1.35 billion.
Pillar II: Rural Development: Less favoured Areas, Environmental schemes –
REPS – AEOS, Forestry Schemes, Leader and other structural support schemes.
In Ireland, these account for about €400 million.
The key difference between CAP Pillar I and II from an Irishagricultural perspective is that Pillar II supports are co-financed. Pillar I supports are exclusively paid from the EU budget.
The EU Budget/CAP Reform Debate to date
The EU Commission kicked off the debate on budget review October 2010. In its communication it stated “The Common Agricultural Policy’s (CAP) needs to evolve, if only because reference values for direct payments are now a decade old. Reforms of varying intensity are possible: from reducing current discrepancies in levels of direct payment to a major shift, away from income support and market measures to environmental and climate change objectives. In 1988, the funding of agriculture amounted to about 65 per cent of the EU budget, these days it is about 40 per cent”.
Last November the Commission published a communication “The CAP Towards 2020” which outlined some of the issues and options facing the EU in the current CAP reform process.
This Commission communication outlined 3 major strategic aims of the CAP:
- To guarantee food security by ensuring viable food production (world demand for food to increase by 70 per cent by 2050).
- To provide citizens with quality, value and diversity of food produced from the sustainable management of natural resources, which contributes to action on climate change throughout the EU.
- To achieve balanced territorial development, by maintaining the viability of rural communities, in particular rural employment.
It undertook to make the CAP greener, fairer, more efficient and more effective and outlined 3 possible policy options:
Option 1This option would introduce gradual changes to the distribution of direct payments between Member States, thereby ensuring continuity and stability with the current CAP.
Option 2This option would involve a major overhaul of the policy in order to ensure that it becomes more sustainable, and that the balance between different policy objectives, issues of farmers and Member States are better met. This option would mean more targeted measures which would be more understandable to the EU citizen. A focus on the EU value added and a policy that addresses EU economic, environmental and social challenges and strengthens the contribution of agriculture to rural areas.
Option 3This option would involve far reaching reform of the CAP with a strong focus on environmental and climate change objectives, while moving away gradually from income support and most market measures. This would provide a clear financial focus on environmental and climate change issues through the rural development policy framework.
The recent Agricultural Council of Ministers meeting on the 17th of March 2011 agreed by majority with these aims and underlined the need for direct income support or EU farmers to ensure fair standards of living. It broadly agreed with the provision of compensation for EU’s higher environmental and animal welfare standards.
In the declaration, ministers said they recognised "the need for a more equitable distribution of direct income support between member states, stepwise reducing the link to historical references”. New objective criteria should be found for distributing direct payments while avoid any sudden change.
The European Commission is due to make proposals on the EU's next Financial Perspective (2014-2020) by the end of June 2011 - including on the future CAP budget - and then to come forward with detailed legislative proposals on the CAP reform in October 2011.
Size of CAP
In justifying the CAP post 2013 there will need to be a clear signal to the European public that CAP expenditure is strategic and that there are benefits to taxpayers (so- called added value of community policies). The CAP currently costs €50 billion per annum and represents 40 per cent of the EU Budget. In 1989 CAP represented 60 per cent of the EEC Budget.
Indications are that there is little scope to increase the CAP budget, this will be more evident later this year in the detailed budget proposals.
Distribution of funds between Member States
There are serious issues being raised by the 12 newer entrant countries as to what additional CAP support will transfer to them in a reformed CAP.
The EU Common Communication Nov. 2010 explains the possibility of a system that limits the gains and losses in these regions so that each state will receive a minimum share of the EU average payments.
The Irish view is that the current distribution must form the basis of the future system and that it must be based on an eligible area, not the utilisable area. The difference between these would amount to Ireland being 22 per cent above the average per ha payment of €249/ha on a utilisable agricultural area base or exactly matching the €249/ha charge on an eligible area basis. In terms of average net direct payments per beneficiary the Irish farmer’s average receipt of €9,000 would be approximately €2,000 higher than the average for the EU 27.
Fair distribution must recognise the higher cost members and be separate from the models used in each member’s state to distribute the payments.
Another important issue is the contribution of member states to the EU budget. Ireland benefits to the extent that we receive 1.89 times what we pay into the EU while Greece, Spain, France and Germany benefit by 2.59, 1.1, 0.95 and 0.61 times their contribution respectively. New members Bulgaria, Hungary, Poland and the Czech Republic benefit by 6.23, 3.92, 3.01 and 2.1 times their contribution.
Distribution within member states
There are also issues of the scale of payments being made to individuals. The arguments here are mainly from a public taxpayer’s point of view; why should one very wealthy person get a huge payment rather than distributing that evenly among others. This raises important issues when the current CAP is being defended.
Argument 1: This is a critical income support.
Response: Why do 80 per cent of the payments go to 20 per cent of the farmers?
Argument 2: This is a vital payment for environmental, social and other public goods.
Response: Bigger farmers have more land and should be compensated equally for adopting better environmental practices.
Some studies which looked at equalisation of payment in Ireland showed that it would result in a geographical shift of payment from the East and South to the North and West. In one study (Gilligan, 2007) this would result in a 13 per cent gain in payment in the BMW Region and a loss in the South and East region of 9 per cent with some areas looking at a 20 per cent loss. Shresthra et al (2007) concludes that in particular large beef and dairy farmers in the southern regions would lose out while small dairy and sheep farmers in the western and northern regions were most likely to gain.
The recent farm council meeting gave little support to capping or reducing payments to higher payment recipients.
Active Farmers
The EU proposes to limit payment to active farmers in response to concerns from taxpayers that public funds are being used to finance lifestyle farmers or non- productive farmers and they would like to ensure that funds are being used to support sustainable production systems. There is little information yet on what criteria might be used to define active and non-active farmers. It is likely that any attempt to introduce objective criteria to differentiate farmers could be prohibitive due to complexity and cost and will be left to individual Member States.
Shift of Funding for Income Support to Rural Development
The EU Commission communication also proposes stronger emphasis on the support of production, protection and competitiveness in its funding for rural development while continuing with strong environmental and rural viability supports. The income support needs to be greener with more equitable distribution of funds and a continuation of safety net market supports. A major concern here is that this will be used to dilute the income support or even promote co-funding from national governments for Pillar 1.
Simplification
It is proposed that a separate simplified scheme should be designed for smaller farmers. The area based system works well. However, it is placing the same requirement on large and small farmers, it may be difficult to separate out. There is also pressure to reduce the amount of administration costs from the member states.
May 2011

